8 Use case 1
8.1 Introduction
In the preceding chapters we have looked at four methods for supervised learning: Nearest Neighbours (chapter 5), Support Vector Machines (chapter 6), Decision Trees (chapter 7) and Random Forests (chapter 7). In this chapter we will consider how we choose the best method for a particular data set.
8.2 Problem: automated detection of malaria
Park HS, Rinehart MT, Walzer KA, Chi J-TA, Wax A (2016) Automated Detection of P. falciparum Using Machine Learning Algorithms with Quantitative Phase Images of Unstained Cells. PLoS ONE 11(9): e0163045. https://doi.org/10.1371/journal.pone.0163045
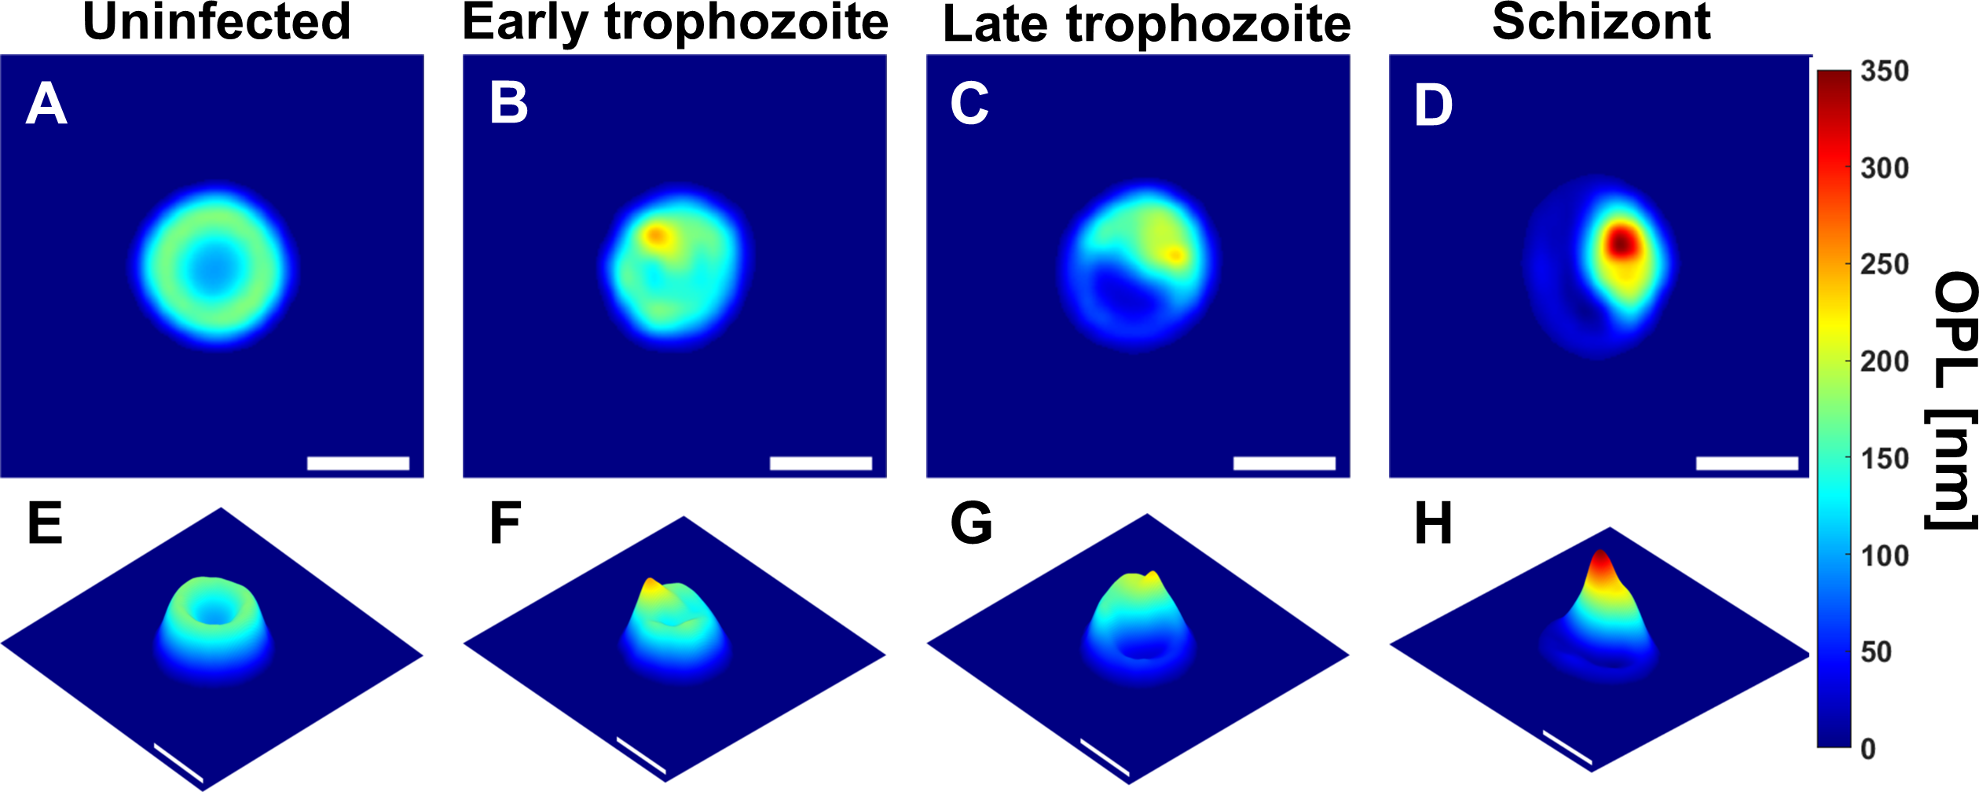
Figure 8.1: Bright-field microscopy images: (A) uninfected RBC (B-D) RBCs with malaria parasite in early trophozoite, late trophozoite, and schizont stages respectively (scale bars = 5μm). Source: Park et al (2016) https://doi.org/10.1371/journal.pone.0163045
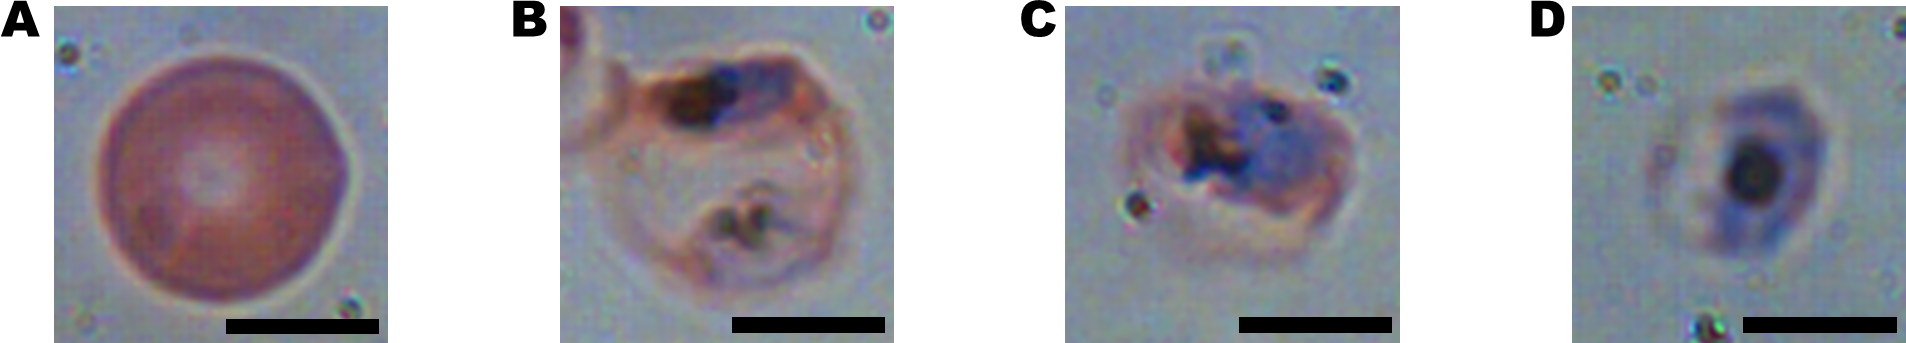
Figure 8.2: Uninfected RBC and RBCs infected by P. falciparum in early trophozoite, late trophozoite, and schizont stages represented respectively as: (A-D) OPL maps, (E-F) OPL maps from different viewpoint (scale bars = 5μm). Source: Park et al (2016) https://doi.org/10.1371/journal.pone.0163045
N.B. These are images of typical specimens. There is actually considerable variation in the appearance of each stage. See the supplementary material for the paper: https://journals.plos.org/plosone/article?id=10.1371/journal.pone.0163045#sec014
Park et al (2016) performed cell segmentation on these images and extracted 23 morphological parameters from each RBC:
- Max optical path length (OPL)
- Mean OPL
- Median OPL
- Optical volume
- Minor axis length
- Major axis length
- Perimeter
- Area
- Elongation
- Equivalent diameter
- Eccentricity
- Standard deviation OPL
- Variance OPL
- Interquartile range OPL
- Skewness
- Kurtosis
- Mean symmetry
- Min symmetry
- Maximum gradient
- Mean gradient
- Centroid vs centre of mass
- Upper quartile mean OPL
- Upper quartile mean gradient
8.3 Challenges
Find the best model for diagnosing malaria (discriminating infected from uninfected RBCs)
Find the best model for staging infection (classifying infection stage: uninfected, early trophozoite, late trophozoite, schizont).
8.4 Getting started
8.4.1 Load data
load("data/malaria/malaria.RData")Inspect objects that have been loaded into R session
ls()## [1] "infectionStatus" "morphology" "stage"class(morphology)## [1] "data.frame"dim(morphology)## [1] 1237 23names(morphology)## [1] "Area" "Major Axis Length"
## [3] "Minor Axis length" "Eccentricity"
## [5] "Mean OPL" "Max OPL"
## [7] "Median OPL" "Std OPL"
## [9] "Skewness" "Kurtosis"
## [11] "Variance OPL" "IQR OPL"
## [13] "Optical volume" "Centroid vs. center of mass"
## [15] "Elongation" "Upper quartile OPL"
## [17] "Perimeter" "Equivalent diameter"
## [19] "Max gradient" "Mean gradient"
## [21] "Upper quartile gradient" "Min symmetry"
## [23] "Mean symmetry"str(morphology)## 'data.frame': 1237 obs. of 23 variables:
## $ Area : num 60.5 60.4 53 57.1 72.8 ...
## $ Major Axis Length : num 8.84 9.18 8.66 8.64 10.64 ...
## $ Minor Axis length : num 8.71 8.39 7.82 8.41 8.72 ...
## $ Eccentricity : num 0.172 0.406 0.431 0.231 0.573 ...
## $ Mean OPL : num 111.5 105.6 90.5 119.5 94.5 ...
## $ Max OPL : num 190 175 152 224 147 ...
## $ Median OPL : num 121 123 104 128 110 ...
## $ Std OPL : num 56 49.7 41.3 62 41.8 ...
## $ Skewness : num -0.368 -0.591 -0.577 -0.268 -0.692 ...
## $ Kurtosis : num 1.8 1.92 1.95 1.83 2.09 ...
## $ Variance OPL : num 3136 2466 1709 3845 1744 ...
## $ IQR OPL : num 100.5 86.5 71.5 107.6 68.9 ...
## $ Optical volume : num 6.74 6.38 4.8 6.82 6.88 ...
## $ Centroid vs. center of mass: num 0.087 0.0557 0.0174 0.125 0.0215 ...
## $ Elongation : num 1.02 1.09 1.11 1.03 1.22 ...
## $ Upper quartile OPL : num 176 157 134 193 137 ...
## $ Perimeter : num 28.8 28.9 27 28.1 31.9 ...
## $ Equivalent diameter : num 8.77 8.77 8.22 8.52 9.63 ...
## $ Max gradient : num 14.7 13.4 12.3 17.5 12.3 ...
## $ Mean gradient : num 7.59 6.21 5.88 8.37 5.1 ...
## $ Upper quartile gradient : num 12.56 11.08 10.09 14.01 9.55 ...
## $ Min symmetry : num 0.995 0.976 0.966 0.984 0.903 ...
## $ Mean symmetry : num 0.997 0.987 0.978 0.991 0.949 ...class(infectionStatus)## [1] "factor"summary(as.factor(infectionStatus))## infected uninfected
## 824 413class(stage)## [1] "factor"summary(as.factor(stage))## early trophozoite late trophozoite schizont uninfected
## 173 314 337 413morphology is a data.frame of the morphological parameters describing the red blood cells.
infectionStatus a factor identifying a red blood cell as either infected or uninfected.
stage a factor giving the stage of infection: early trophozoite, late trophozoite, schizont or uninfected.
8.4.2 Model comparison
Explore how CARET’s resamples function can help you compare models:
?resamples## No documentation for 'resamples' in specified packages and libraries:
## you could try '??resamples'8.5 Solutions
We have provided worked examples in appendix G. Can you come up with better solutions?